

Turn your data into Decisions and Actions
We help you create interactive dashboards where you can visualize your company's information in a more structured way, with analysis focused on decision-making.
- Tailored design
- Report support and maintenance
- Guidance and recommendations
- Automated reports
Data Visualization Expert
Get in touch with us to create value through data.
Close the gap between data and decisions
We use Power BI to create amazing data experiences that help you make decisions with confidence.
Multiple Data Sources
Connect directly to hundreds of on-premises and cloud data sources, such as Dynamics 365, Azure SQL Database, Salesforce, Excel, and SharePoint.
End-to-End Security
Protect your information in Power BI at all times, even when you share reports outside your organization.
Office Integration
Get the most out of Power BI by integrating it with other Microsoft tools such as Office or Azure.
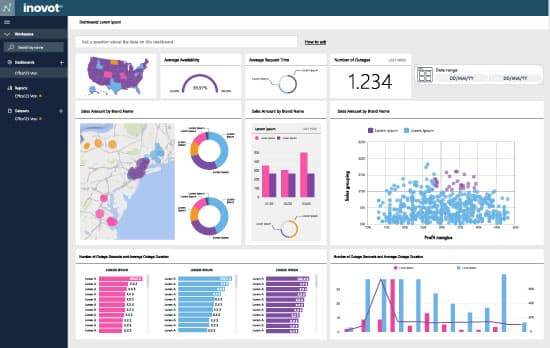
Dynamic, Collaborative, and 'Self-Service' Reports
Work together on the same data and collaborate as a team on reports while sharing insights. We connect your dashboard to Microsoft Office applications (such as Teams and Excel) so everyone in your organization can quickly make data-driven decisions and drive meaningful actions.